Streamline Your Business with Organisation Charts - Draw.io Template

An organizational chart serves as a visual representation of an organization, illustrating the hierarchical relationships, roles, and responsibilities among various individuals and departments.
As organizations evolve and adapt to changing environments, their organizational charts may also undergo modifications to accommodate new roles, departments, or changes in reporting structures.
What are Organizational Charts or Hierarchy Charts?
An organizational chart, also known as a hierarchy chart, is a visual representation of an organization's structure, showing the relationships, roles, and reporting lines between different individuals or departments within the organization.
Purposes of Organizational charts
They provide a clear visual representation of the reporting structure and roles within an organization, helping employees understand where they fit in and who they report to.
Organizational charts aid in communicating the organization's structure to new employees.
Clear reporting lines can help prevent confusion and conflicts over roles and responsibilities.
Components of an organizational chart included:
Each position or role in the organization is represented by a box or node in the chart.
Lines connecting the boxes indicate the reporting relationships within the organization.
The vertical arrangement of boxes indicates different levels of hierarchy, with the highest group usually at the top (e.g., CEO or president) and lower levels cascading down (e.g., managers, employees).
Organizational charts can also show different departments or divisions within the organization.
Sample Example
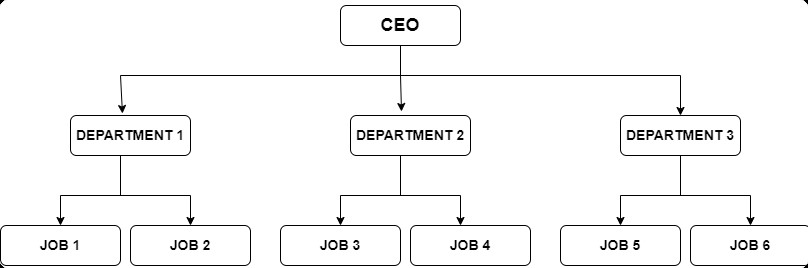
Download Sample Organisation Template
Step-by-step Draw.io setup
Creating an organizational chart (org chart) in Draw.io is a straightforward process that allows you to visually represent the structure of an organization, including reporting relationships and hierarchies.
At Makeinfo, we understand that your time is valuable, and that's why we've designed WorkConnect360 to seamlessly integrate the Org chart into your existing workflow.
WorkConnect360 provides advanced features and facilities for your organization.
If you want your organizational chart to be simple and attractive.
Try WorkConnect360 Now.
Comments
Join the discussionNo comments yet. Be the first to comment.
